Although the exact relationships between the earliest land plant lineages are not yet well resolved, there is consensus that liverworts are one of the most ancient land plant groups. We are also confident that liverworts are a “good” taxonomic group, united by morphological and structural similarities, as well as by analyses of molecular sequence data that show that the entire group shares a common origin.
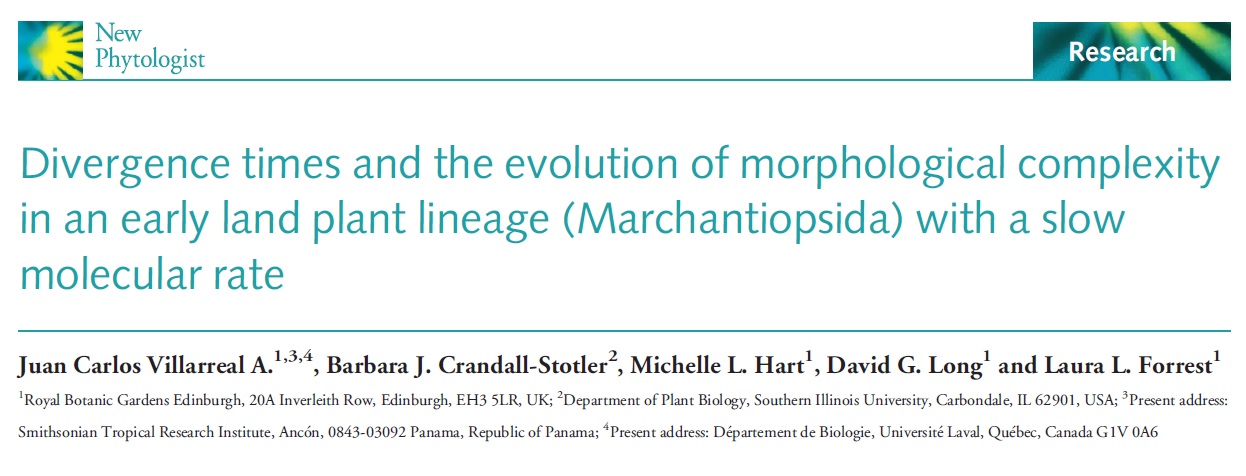
Fig 1a, Villarreal et al. 2015: molecular branch lengths across the liverwort tree of life, based on sampling in Laenen et al. 2014.
However, as a group, liverworts encompass a lot of variation – for example, some have leaves, some don’t; some have specialised sexual branches, others don’t; some grow in water, some on leaf surfaces, some on rocks; some are green, some red or brown, some closer to black… A less familiar metric that also varies across the liverworts is the rate of evolution of different parts of their genomes. Strikingly, complex thalloid liverworts have slow rates of molecular evolution for both the plastid and mitochondrial organelles. (In the figure on the left, they are the lineage represented in brown.)
While this phenomenom has been commented on by various authors over the years (e.g. Forrest et al. 2006), hard data has been lacking. Given the amount of sampling that we have for the complex thalloids, we have finally been able to put a number on it: We have calculated the rate of molecular evolution for the plastid to be 2.63 x 10⁻¹⁰ (SD 4.6 x 10⁻¹²) substitutions per site per year, based on coding sequences from atpB, psbA, psbT-psbH, rpoC1, rbcL and rps4, and the mitochondrial rate to be 5.31 x 10⁻¹¹ (SD 9.4 x 10⁻¹³) substitutions per site per year, based on coding sequences from nad1, nad5 and rps3. The absolute mean substitution rate for the nuclear large ribosomal subunit (26S) is faster, at 7.76 x 10⁻¹⁰ (SD 1.4 x 10⁻¹¹) substitutions per site per year.
In contrast, for the sister group (most other liverworts, shown in green in the figure), the calculated plastid rate, based on rbcL, is over three times higher than that for the complex thalloids, at 9.0 x 10⁻¹⁰ (Feldberg et al. 2014).
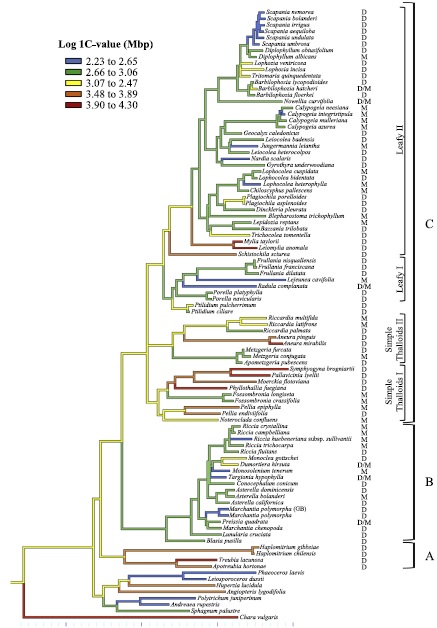
Bainard et al. 2013, Fig 1: Parsimony reconstruction of nuclear genome size in liverworts (blue = small, red = large)
However, seeing that there is a difference is the easy part; finding an explanation that fits the pattern is quite something else. Why would orgenellar genes evolve more slowly in the complex thalloids than in Haplomitrium, Treubia, the simple thalloid clades or the leafy liverworts? Could it tie in with a phenomenom known as RNA editing that is common to most liverwort lineages, but lacking in the complex thalloids? Do complex thalloids have longer generation times than the other liverworts, or slower metabolisms? On average, complex thalloids also seem to have smaller nuclear genomes than other liverwort lineages, although this is a broad generalization, with comparatively few genomes measured.
While we came up with some speculations in our last paper, we certainly don’t yet have an answer!