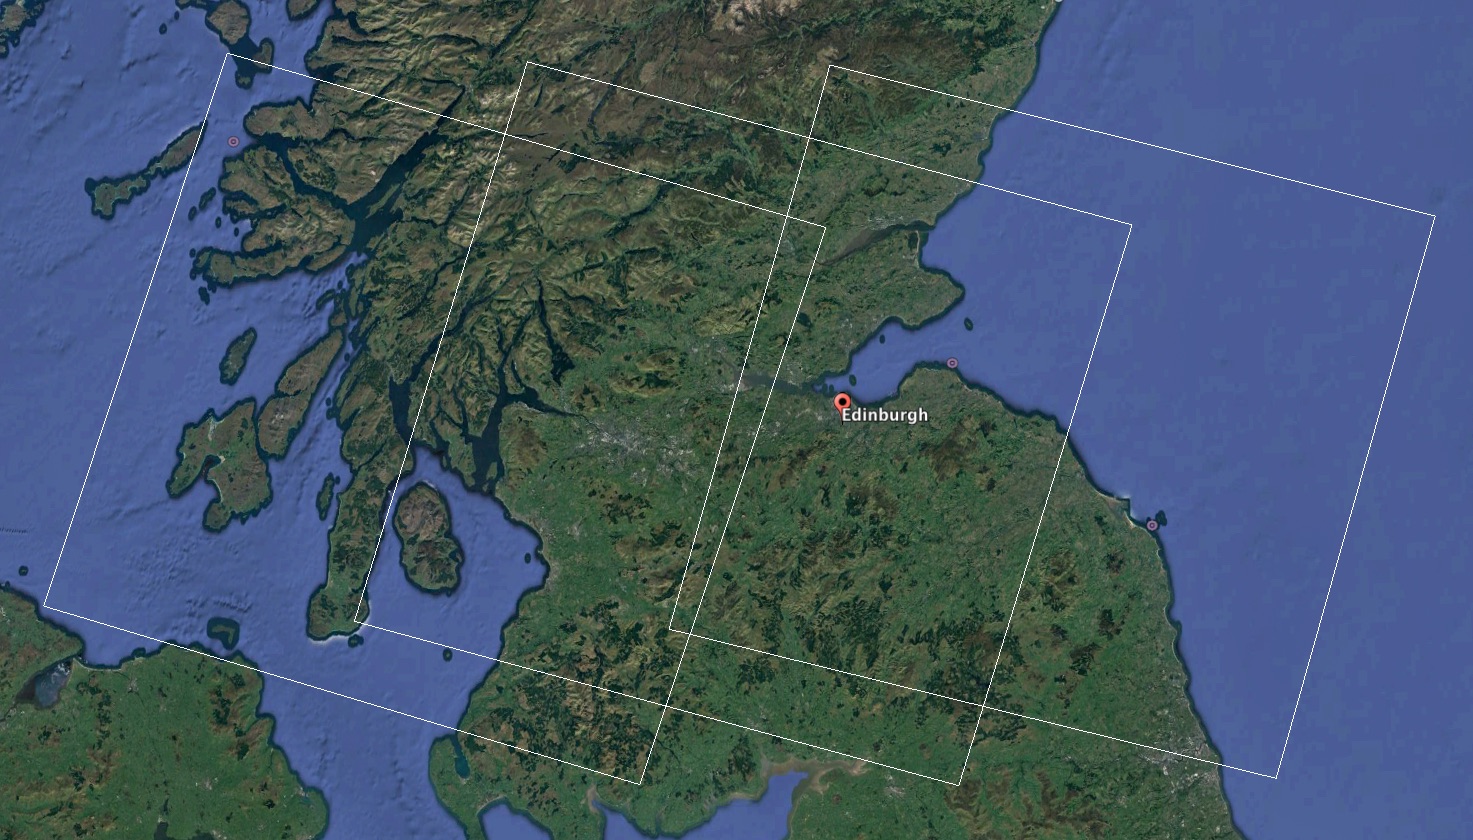
Three Landsat 8 Scenes covering central Scotland
I’ve been looking at producing a good quality Normalized Difference Vegetation Index (NDVI) dataset for central Scotland so that I can investigate correlation between green space, biodiversity and well-being indicators. To do this I need access to satellite imagery.
Fortunately every sixteen days the Landsat 8 satellite passes over every part of the earth photographing at a resolution of 30 metres in eleven spectral bands. The U.S. Geological Survey generously make this data available for free and Amazon kindly distribute it as one of their public datasets. NDVI can be calculated by simply comparing the red and near infra-red bands of these images. It sounds very simple until we get into the detail.
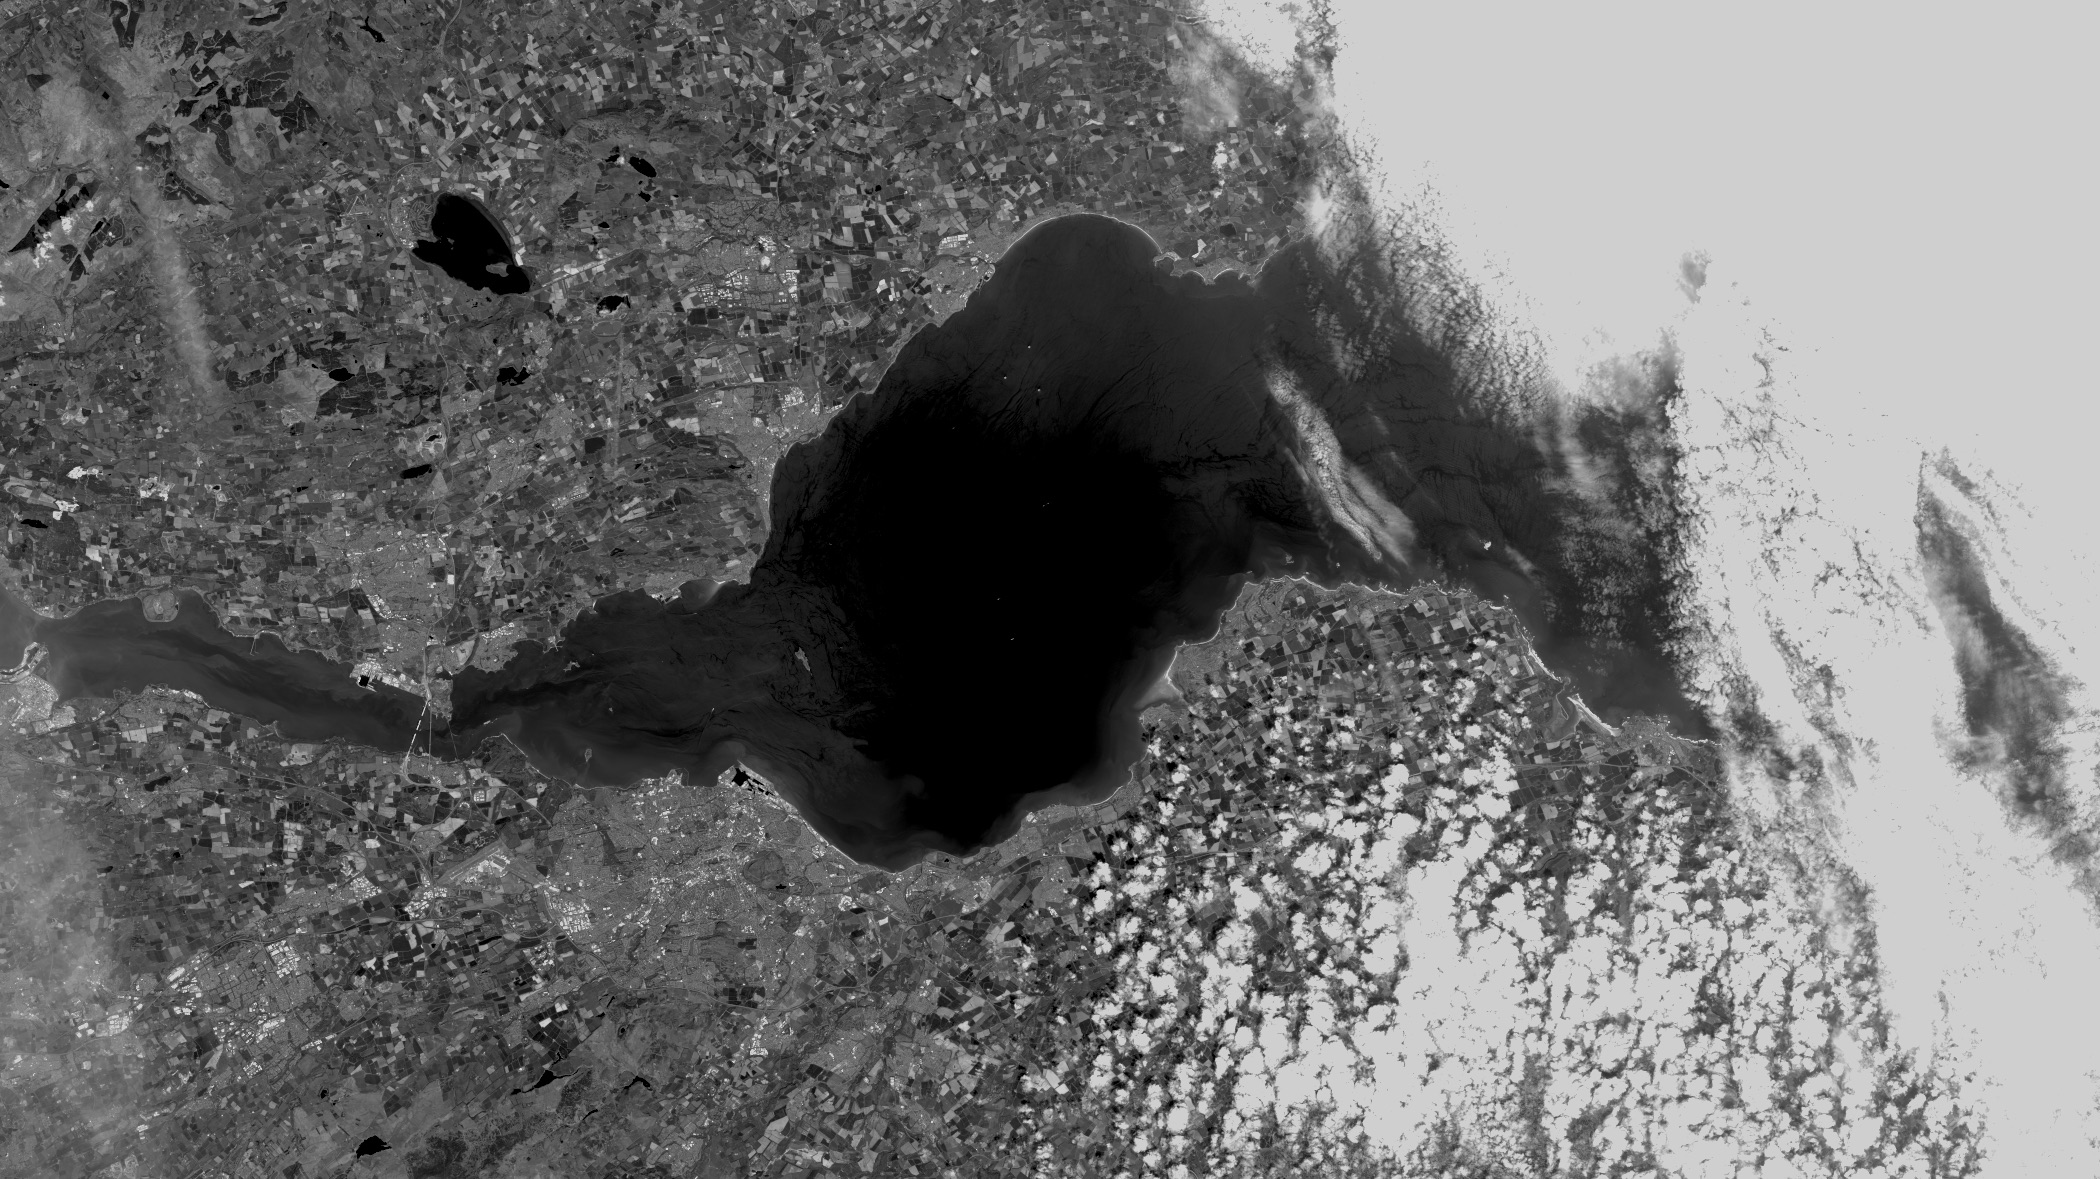
Landsat 8 Panchromatic sample captured on 3rd June 2016 (note incomplete new Forth crossing)
NDVI is a measure of light absorbed by chlorophyll but much of the vegetation in Edinburgh and Glasgow that I am interested in is only actively growing for half the year. It is therefore important to compare images from different times of year. For consistency I’d like to restrict the data to the Landsat 8 satellite which entered into service in 2013 which further restricts the number of potential images. The Google Earth snapshot above shows the extent of the three Landsat scenes that cover the area of interest. Because we are so far North they overlap and so most of our area of interest is covered by at least two of the scenes and therefore imaged on average every eight days. From mid 2013 until today this adds up to 187 images. More are being added all the time. This all seems good but we then run into the next problem.
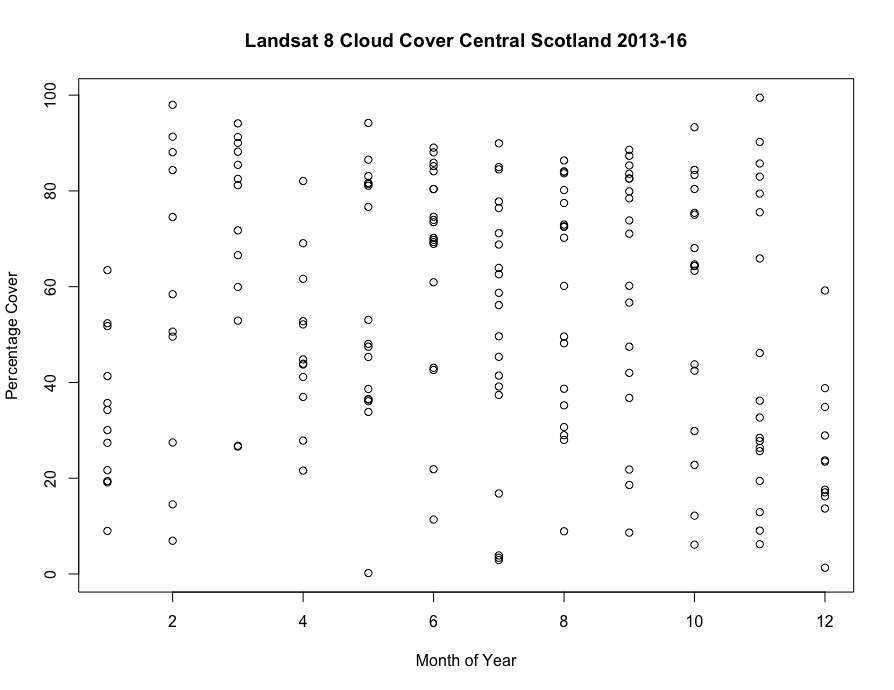
If you are in central Scotland and look straight up the chances are you will see clouds. This isn’t just a stereotype of Scottish weather (or character?) but is supported by the data. The graph below shows the percentage of cloud cover in each of the 187 available images. The average cloud cover is 55%. For a crude analysis I may be able to select individual images from different years to represent winter and summer but if I want to have a more granular understanding of seasonal change, some indication of change through the years and some redundancy to correct for errors I’ll need to do something more sophisticated.
 To build my dataset I will therefore have to write scripts that examine all images created for these scenes, remove clouded areas and calculate NDVI for the remaining parts. These parts will then form a jigsaw puzzle that can be assembled in different ways to give seasonal or temporal change for different sub areas. The system should update automatically or semi-automatically as new scenes are released onto the Amazon hosting platform. Well that is plan anyway.
This all makes me very appreciative of the Google Earth data which, apparently effortlessly, does this process at higher resolution for visual satellite imagery, merging it with aerial photography as you zoom in.
Update: I just discovered the USGS service for surface reflectance corrected NDVI and EVI products – this may save some work and cut Amazon out of the loop.