By Sandra Angers-Blondin, PhD student, School of GeoSciences, University of Edinburgh
The Arctic is warming rapidly and, as a result, tundra plants are growing faster and colonising new environments. This “greening” of the tundra is expected to have important consequences on the ecology as well as on the energy and carbon budget of the Arctic, because of the many complex ways in which plants interact with animals, soil microbes, permafrost dynamics, solar radiation, etc
The Arctic is warming more rapidly than the rest of the planet and tundra ecosystems are facing dramatic changes.
Shrubs, the “trees” of the Arctic, are particularly responsive to climate change and have recently been expanding all around the tundra biome. However, this expansion is not uniform because so many factors other than climate can influence shrub growth. For instance, shrubs compete amongst themselves for water, light and nutrients. Therefore, the “losers” of these competitive interactions may find themselves unable to respond to improved climate because they lack the building blocks they need to grow. My PhD research aims at understanding how these interactions between plants influence their climate response. This could be a key mechanism explaining the highly variable climate sensitivity of shrubs across the tundra biome.
Shrubs have been expanding in tundra ecosystems over the last half-century. On this photo, dense, knee-high dwarf birch (Betula glandulosa) has become dominant on previously lichen-covered land in Umiujaq, Northern Québec.
To investigate the matter, I spent last summer sampling tundra shrubs across the Canadian Arctic, both in the Yukon Territory and in Northern Québec. At each site, my coworkers and I mapped all the shrubs within 6 plots with a laser distance measurer and then harvested their root collar (the “trunk”) to perform dendrochronological analyses.
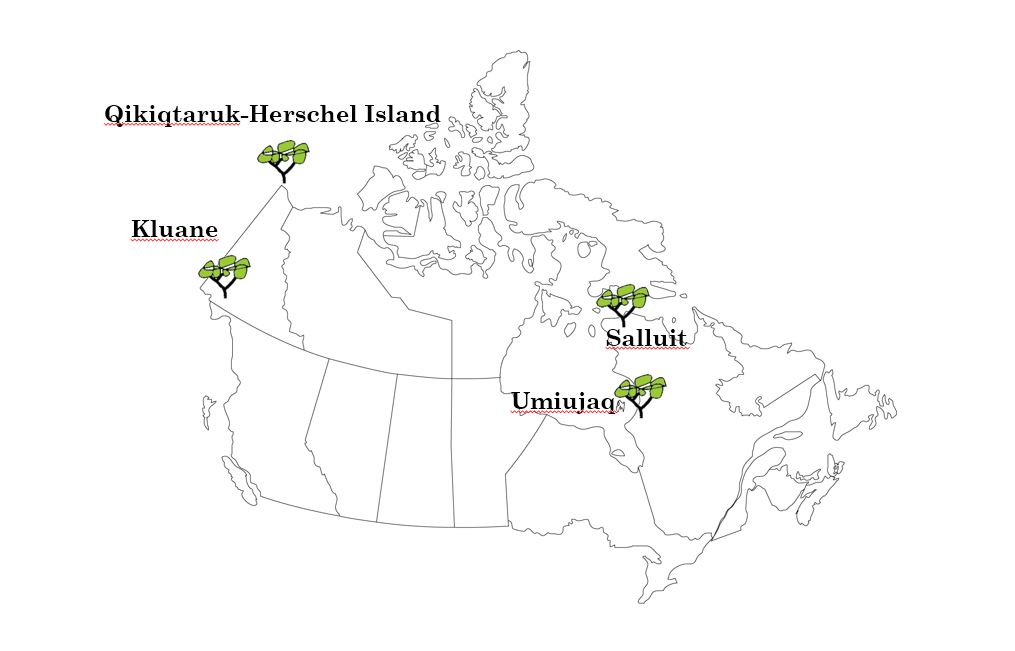
My field sites in Northern Canada: Kluane and Herschel Island in the Yukon Territory and Umiujaq and Salluit in Northern Québec. These sites form two latitudinal gradients spanning ca. 1000 km and will allow to test for the relative importance of competition across different climatic conditions.
Just like trees, shrubs are woody species that add a layer (ring) of growth every year. The width of any given ring generally represents the growing conditions of that year: warm weather leads to wider rings, while cold summers, insect outbreaks, nutrient shortages or other disturbances lead to narrower rings. The only problem is that these rings can sometimes be only a few cells wide, and a stem the width of your thumb can easily be over 50 years old! The samples therefore need to be carefully processed before we can see, let alone count and measure the rings.
This is where the RBGE comes into play: miraculously, a lovely vintage sledge microtome from the 1960’s still survives there! Microtomes are similar to what a butcher uses to slice your ham, and are great for slicing hard wood into paper-thin sections that can then be mounted on a slide and viewed under the microscope. The only thing left to do is to take a digital photograph and use an imaging software to measure the growth rings.
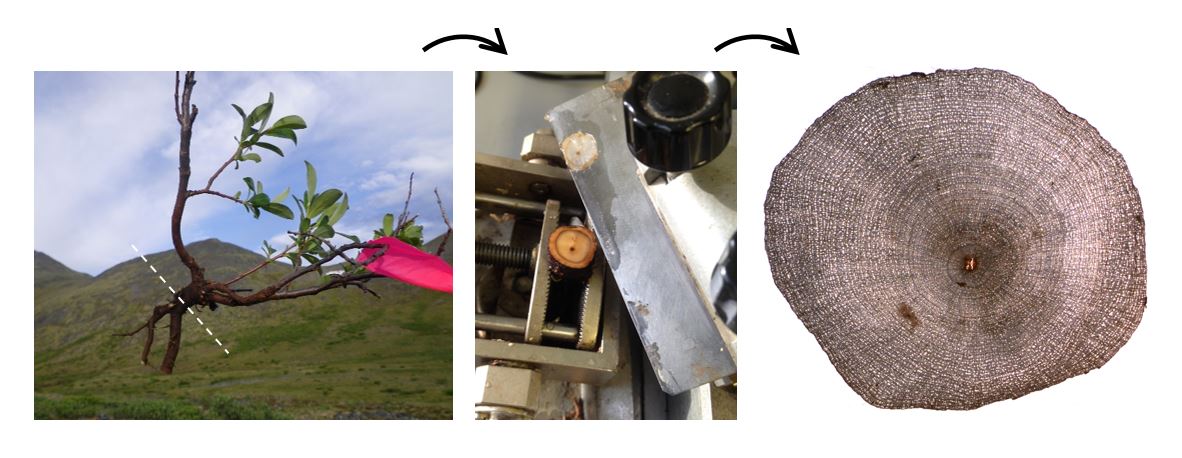
The steps of shrub dendrochronology: sample the root collar (white line), cut the sample with a microtome and photograph the thin section under a microscope. This shrub stem the size of a 5 pence coin is around 60 years old!
Once these 1000+ tiny shrubs are all processed and measured, I will try to link the spatial relationships between the shrubs in my plots (obtained by my mapping exercise) to their climate sensitivity (measured through dendrochronological analyses). I expect to see a trend where shrubs with many neighbours have lower growth rates and display weak year-to-year correspondence to climate, whereas isolated shrubs that have access to all the resources they need should be growing better and responding to variations in temperature. This is the first time something like this is being tested with tundra shrubs and will hopefully give us a better understanding of how competition affects the response of Arctic plants to climate change.
Thank you for reading and stay tuned for the results!
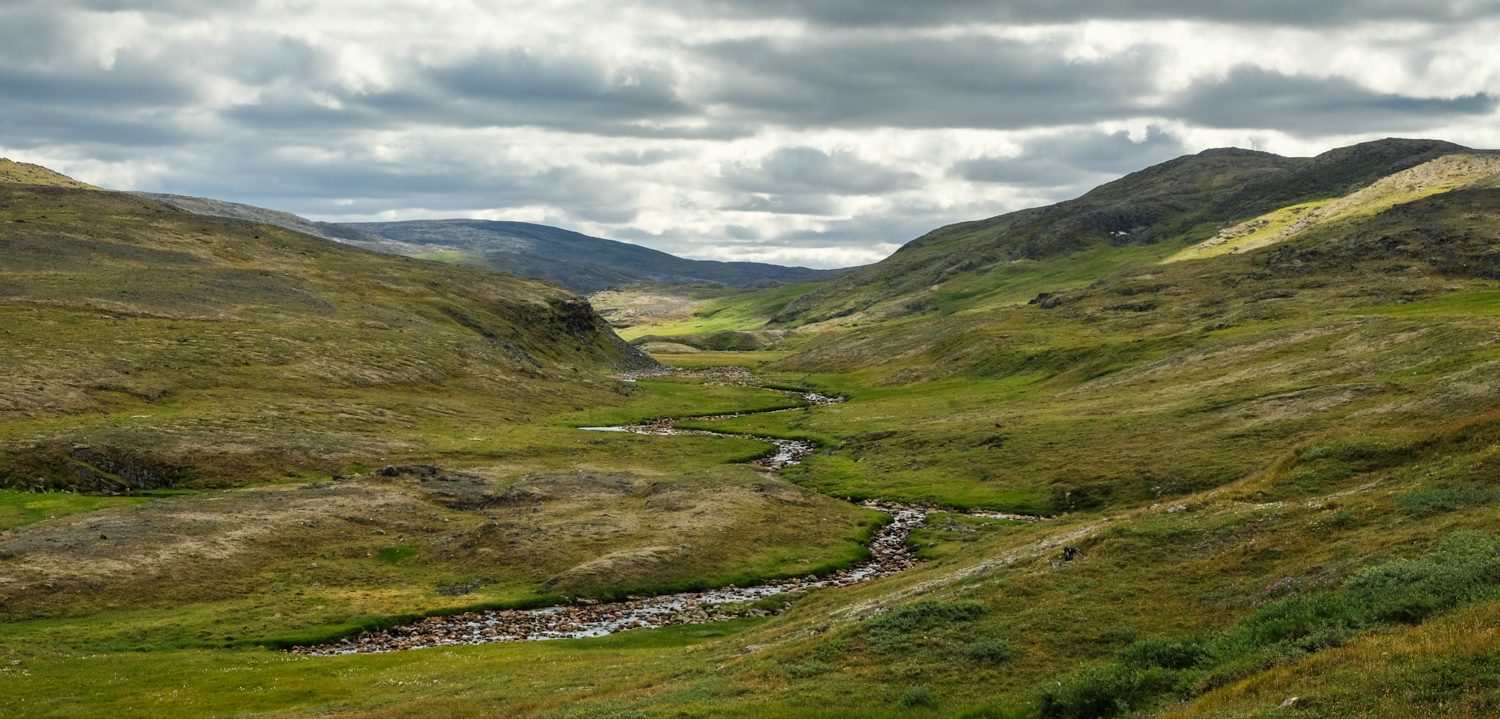
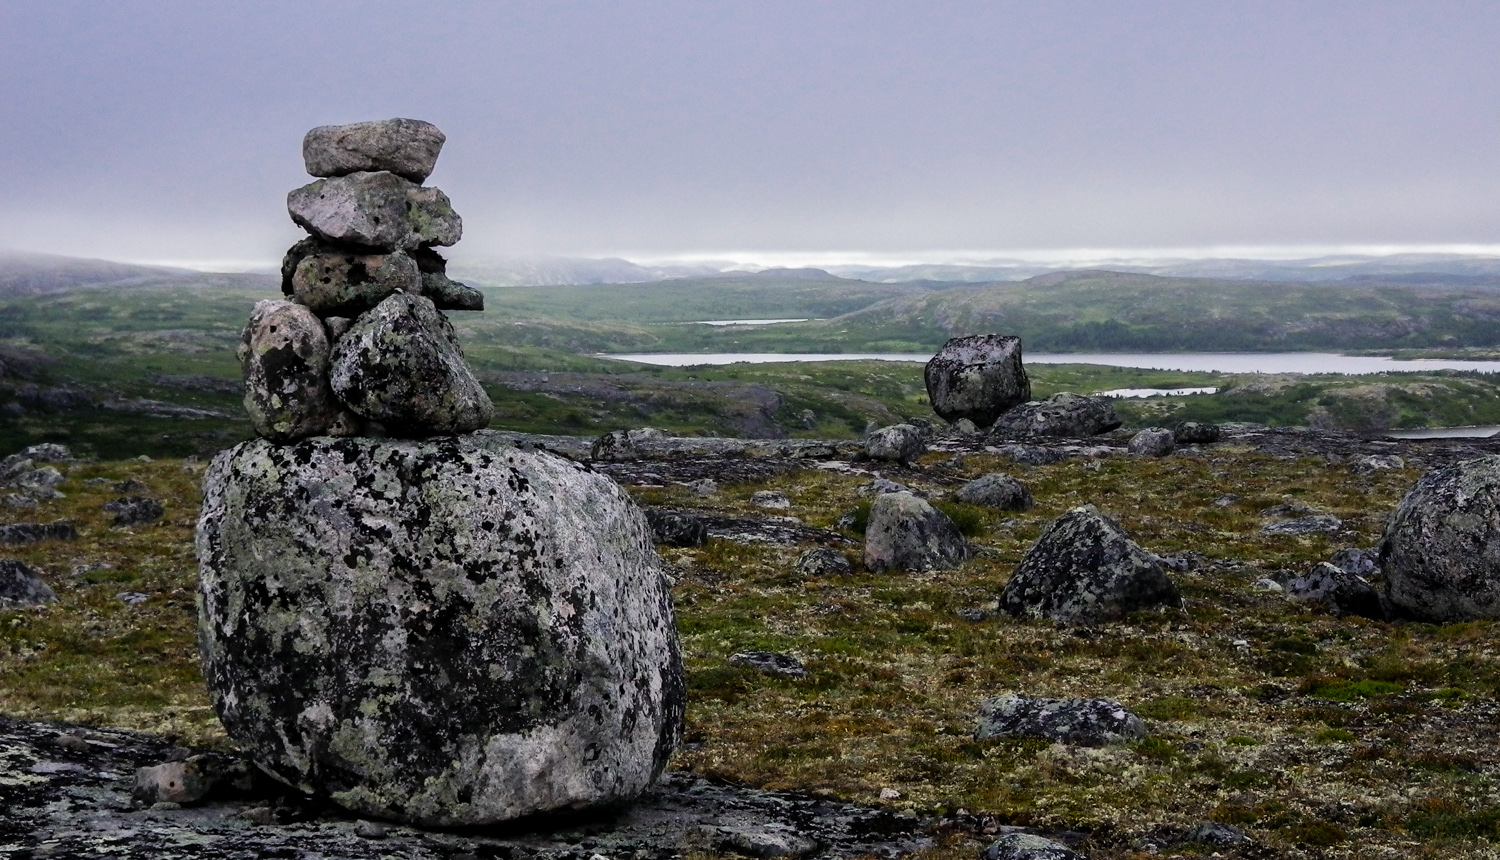
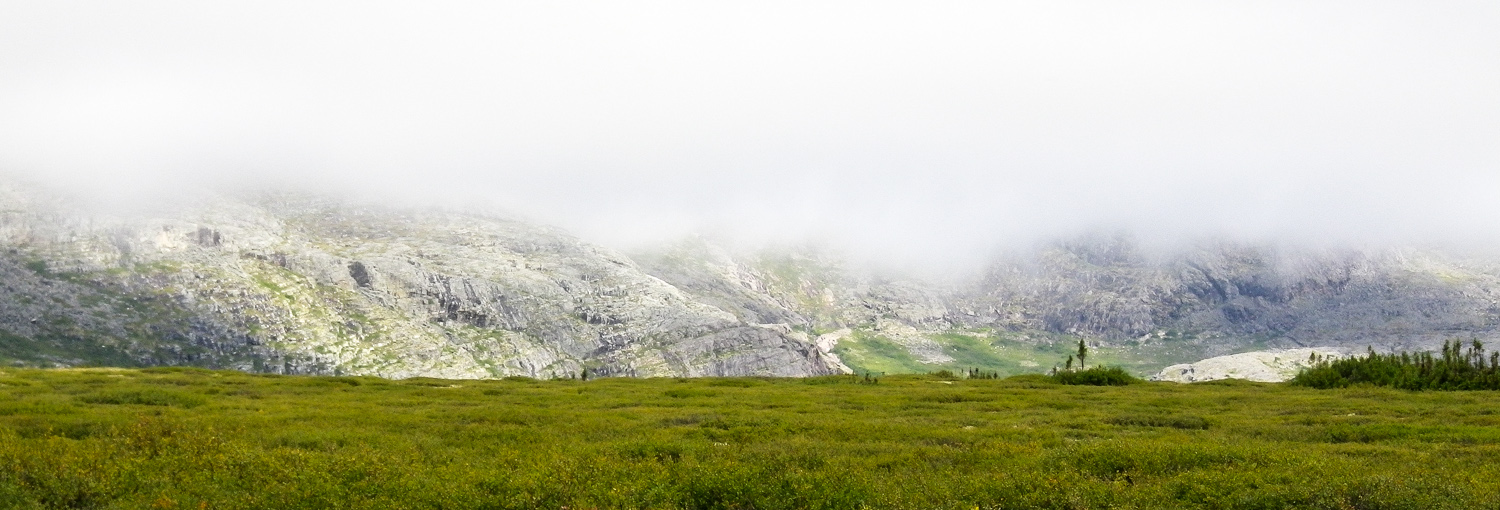
The gently rolling hills of Salluit. Doesn’t it look a bit like Scotland?
Contact me: S.Angers-Blondin@sms.ed.ac.uk
Caoline
Super explication Sanda! Je ne savais pas que ton doc était si proche de ma maîtrise, j’avais l’impression que tu décrivais mes travaux de labo :p
Vraiment un beau projet, j’espère que tu aimes ça! Tu retournes dans le nord combien d’autres étés?
katia
Salut,
Je me spécialise en biostatistique et j’analyse des données obtenue sur ce genre d’expérience mais pour une espèce différente. Je me demandais comment t’y prends-tu pour définir le modèle de compétition qui te permettra de valider tes résultats? Sachant que l’effet de compétition n’est pas à négliger pour les shrubs groupés.