This last week I’ve actually managed to spend a bit of time in the lab, trying to get some gaps filled in a DNA barcoding matrix for simple thalloid liverwort Aneura. David Long and I are heading off to Trondheim in just over a week to combine our data set with one generated by Ana Maria Séneca Cardoso, working with Lars Söderström and Kristian Hassel at NTNU.
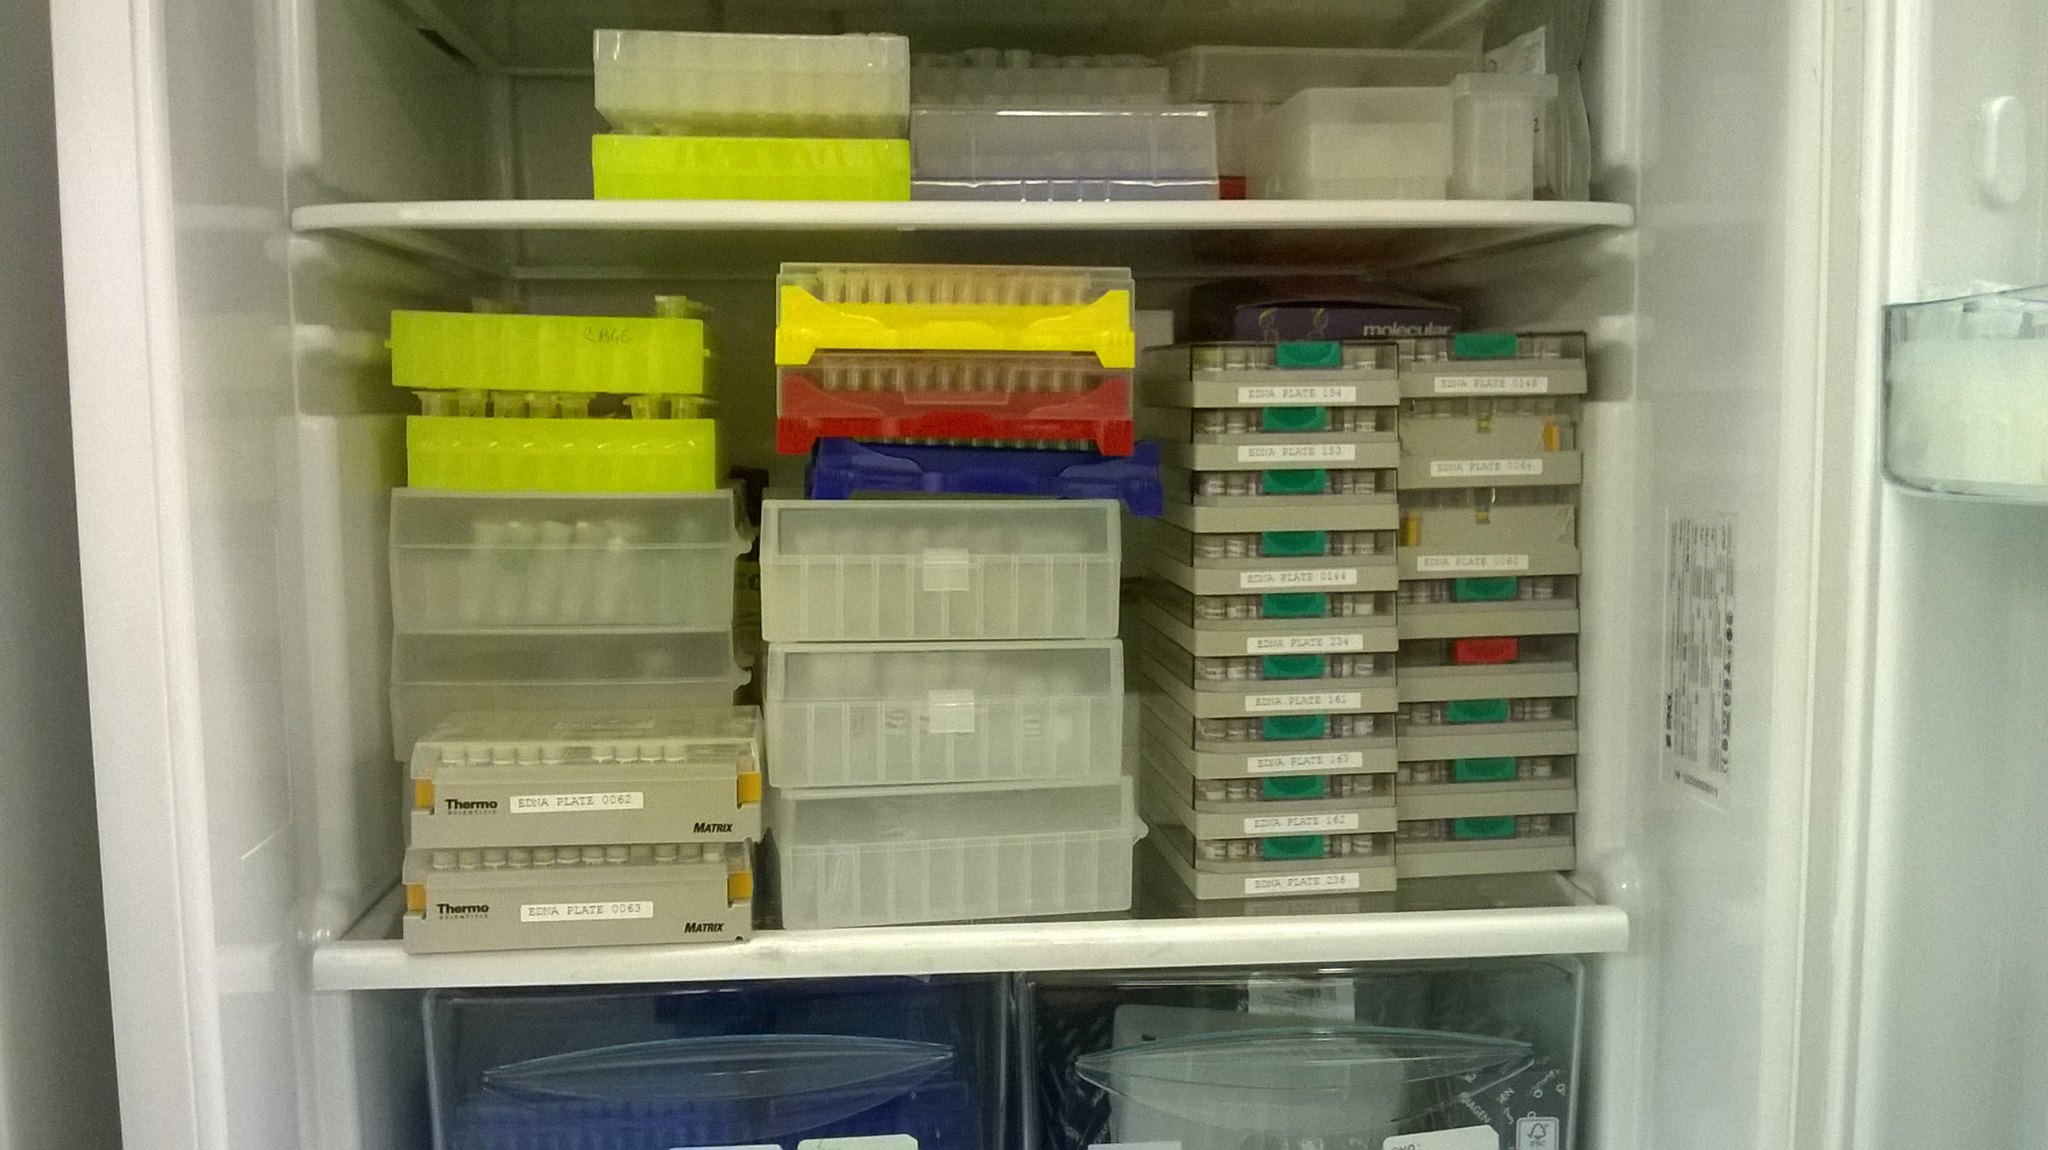
A fridge shelf piled with racks and plates of DNA in the RBGE PCR lab
Many of the DNA extractions that I have been trying to amplify are old (with a very few that were extracted 14 years ago at Southern Illinois University). Most of them have already been tried, and have previously failed to amplify, for the four selected barcode markers (three plastid genes, rbcL, rpoC1 and matK, and one plastid intergenic spacer region, psbA-trnH; a nuclear marker, ITS2, was originally included, but proved difficult to get good sequence data from). Most of the DNA extractions I’ve needed were scattered across a large number of Edinburgh DNA bank (EDNA) plates, while some of the rest of it had never been aliquoted out of the original QiaXtractor plates.
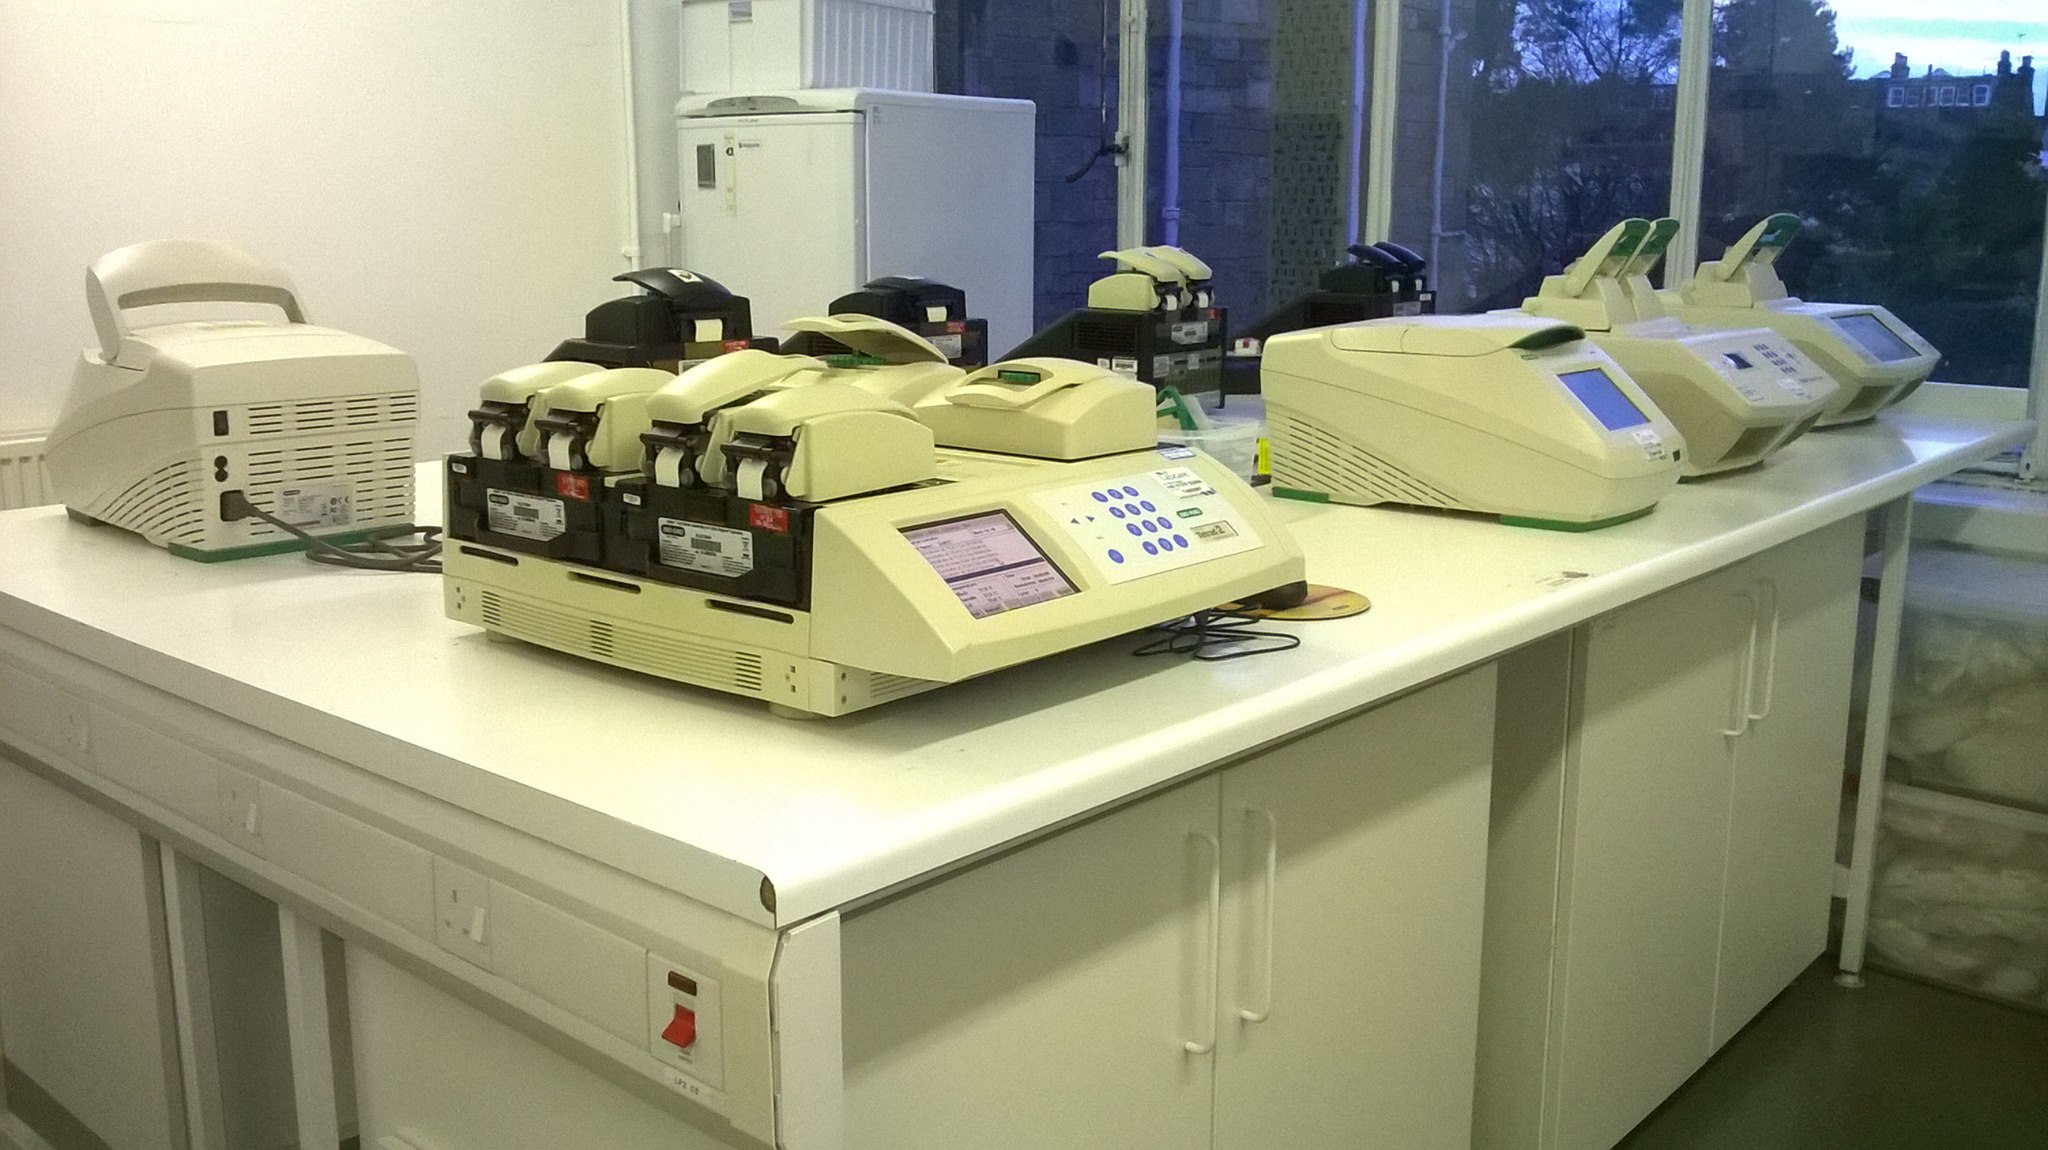
Our hard-working PCR machines wait for samples in the RBGE molecular lab
Because the amount of time needed to chase down the DNA samples was more than the amount of time needed to set up the reactions, and because my default protocol has changed, over the course of this project, from using CES as a PCR enhancer to using TBT-PAR as a PCR enhancer, I decided for three of the loci to test the amplification with both CES and TBT-PAR, building on from a previous Botanics Stories posting. (The exception was matK, for which we use a different polymerase, Invitrogen’s Platinum, and 5M betaine as a PCR enhancer; we have found that this gives better sequence reads than amplification with a standard Bioline taq does.)

Getting ready for PCR – my reagents defrosting on ice
Reactions were set up in 20 ul, using exactly the same reagents (Sigma water, 5x buffer, magnesium, dNPTs and forward and reverse primers, with 1 ul each of the Aneura DNA extractions), with the exception of the 4 ul of either CES, or TBT-PAR, per sample.
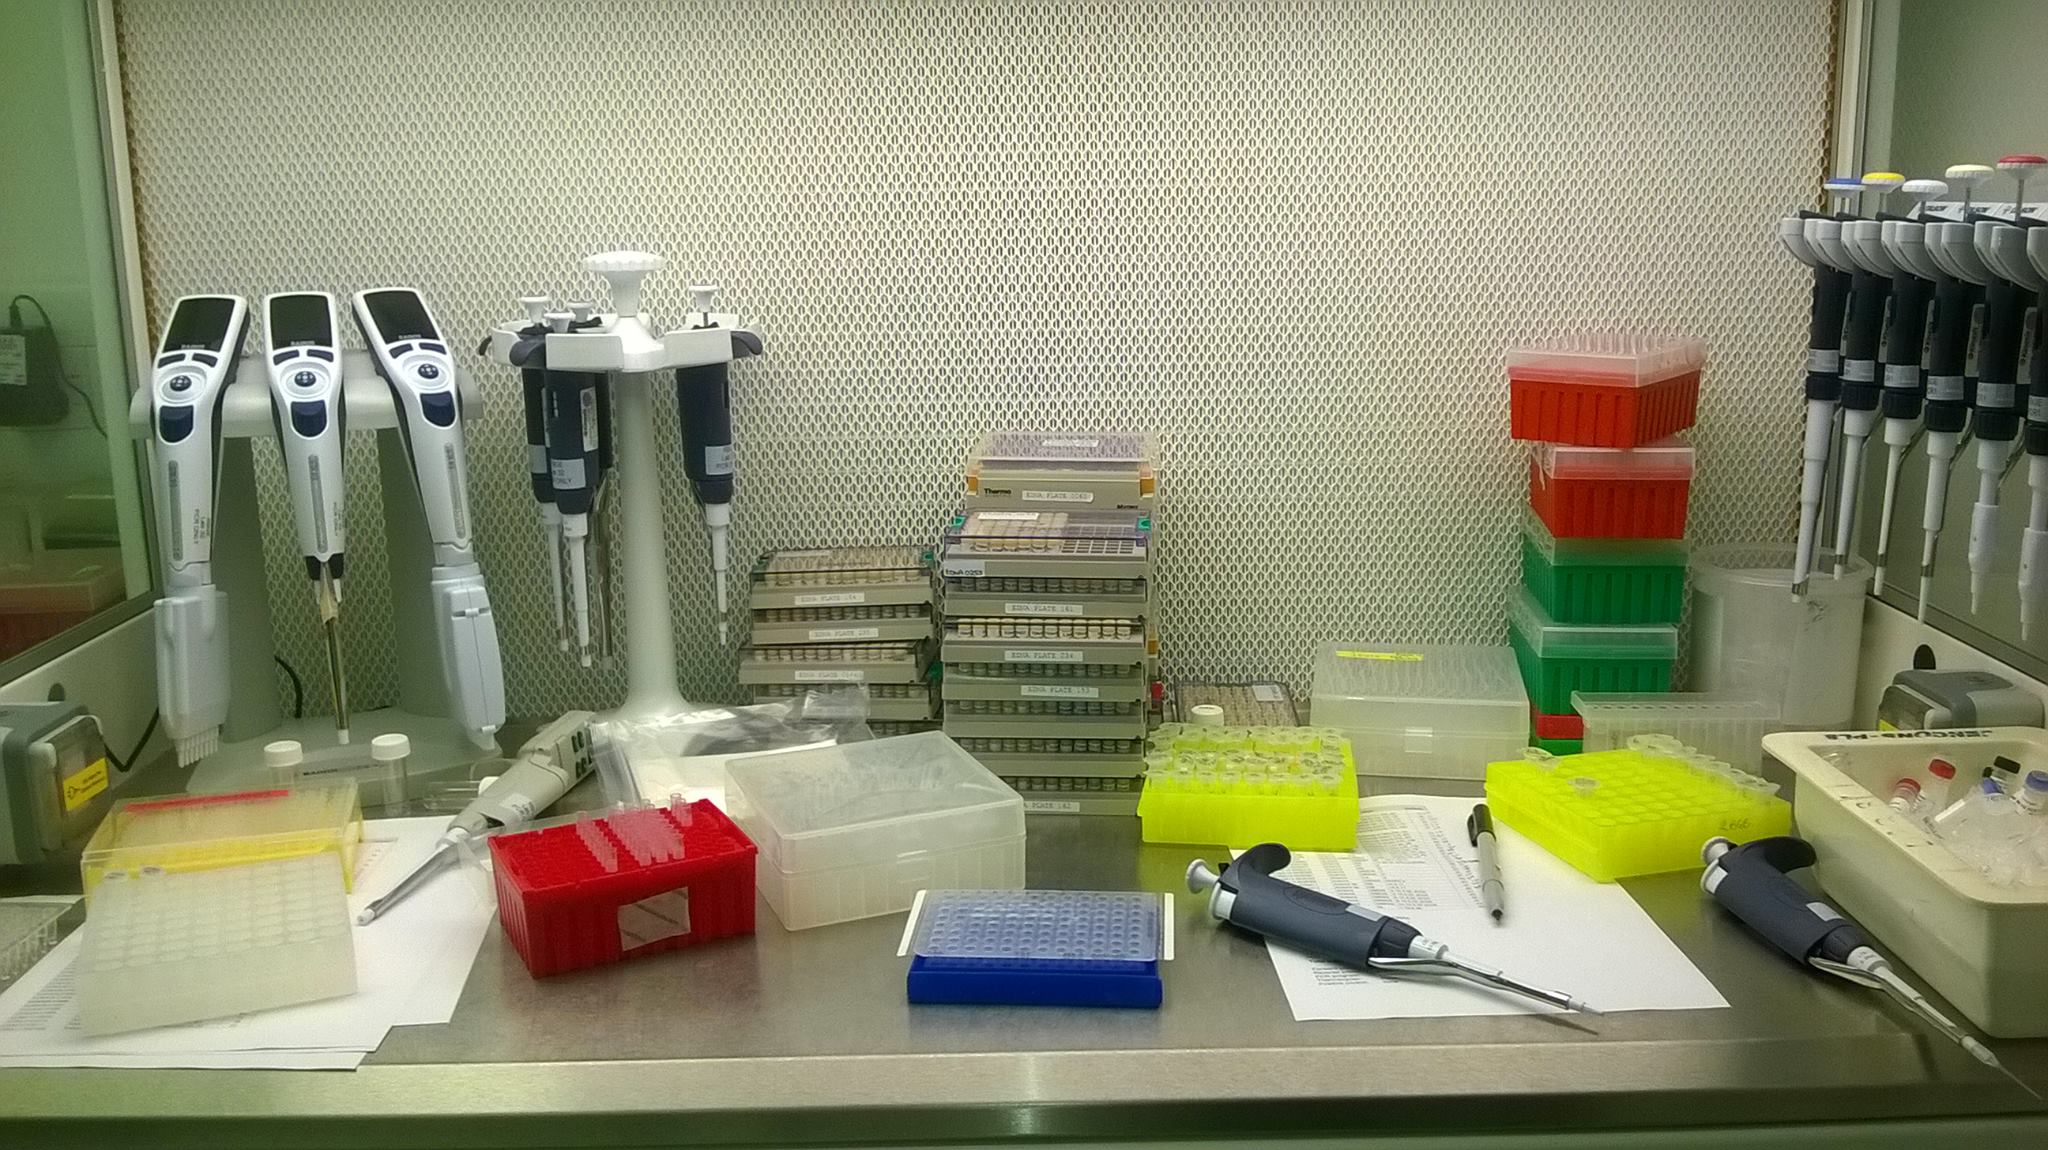
Inside the laminar flow hood and ready to go
The PCR products were all run out on standard 1% agarose TBE gels, at 80 volts, for 40 minutes, stained with SybrSafe, and visualised under a blue light, to test for amplification success. As a size standard, 3.5 ul of an Invitrogen 1 kb ladder was loaded at intervals on each gel.
Several of these gels are shown below. In these images, DNA is stained so that it fluoresces in bright blue or UV light. The samples have been loaded into the gel in holes, or wells, that can be seen at the top of, and at regular intervals down, the gel, and migrate through an electric current towards the positive electrode that would be at the bottom of the image. Smaller fragments move faster through the gel, meaning that samples can be separated by the lengths of the DNA fragments.
The comparisons of amplification success with CES and TBT-PAR are unfortunately ambiguous.
For the psbA-trnH region, using TBT-PAR was more successful than using CES – as can be seen particularly clearly in the second row down, where only 3 of the 8 extractions amplified with the CES additive, but all 8 amplified with TBT-PAR.

Aneura DNA amplified for the psbA-trnH region: left hand side – with CES additive; right hand side – with TBT-PAR additive
For both rbcL and rpoC1, it’s harder to get a clear picture. Some samples amplified with one additive rather than the other, while most samples amplified with both.
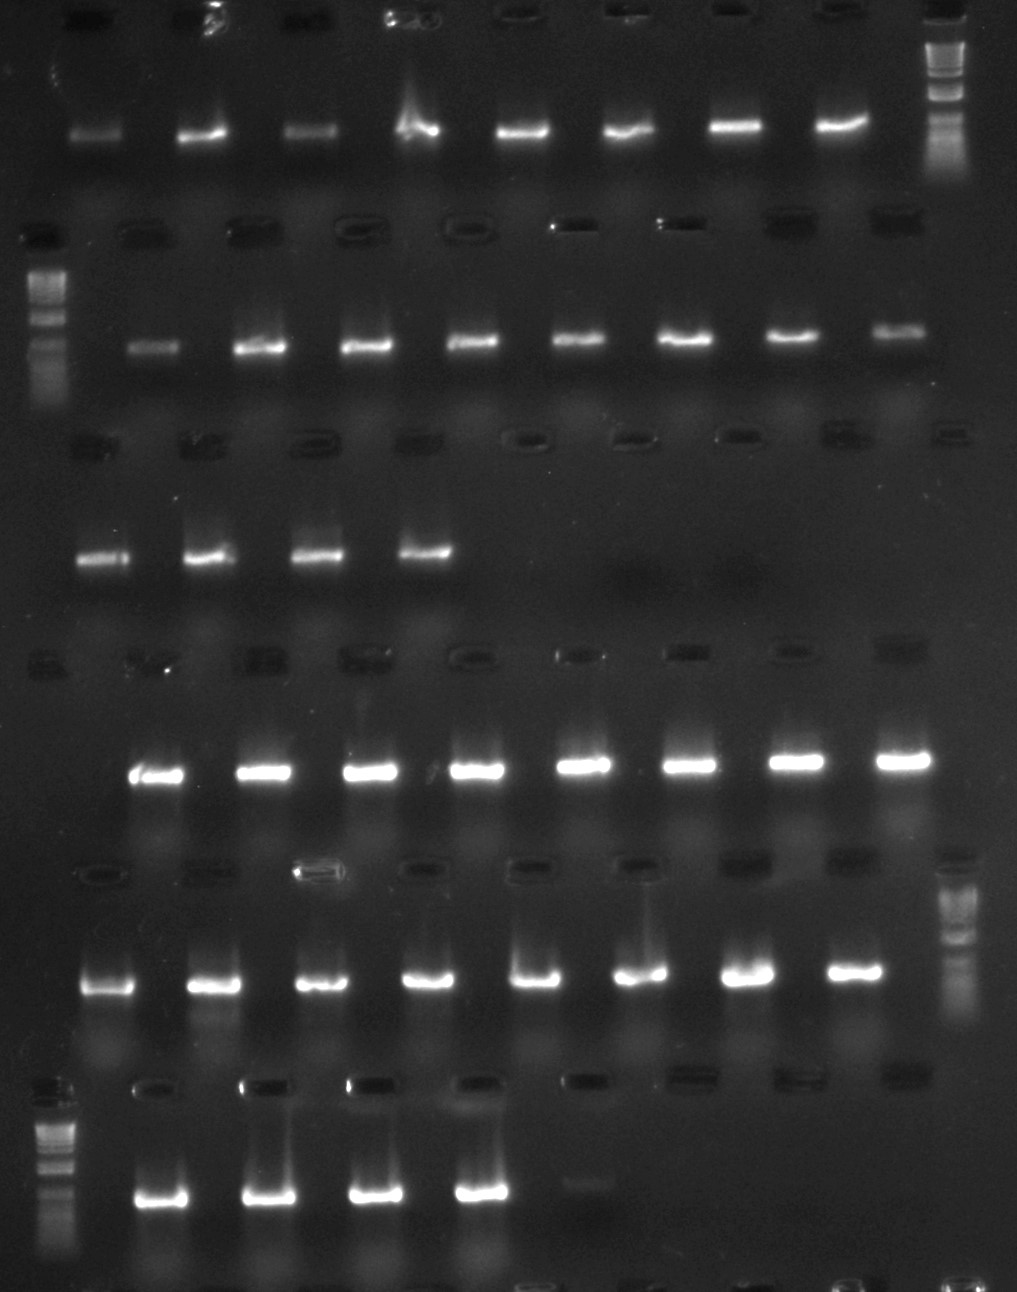
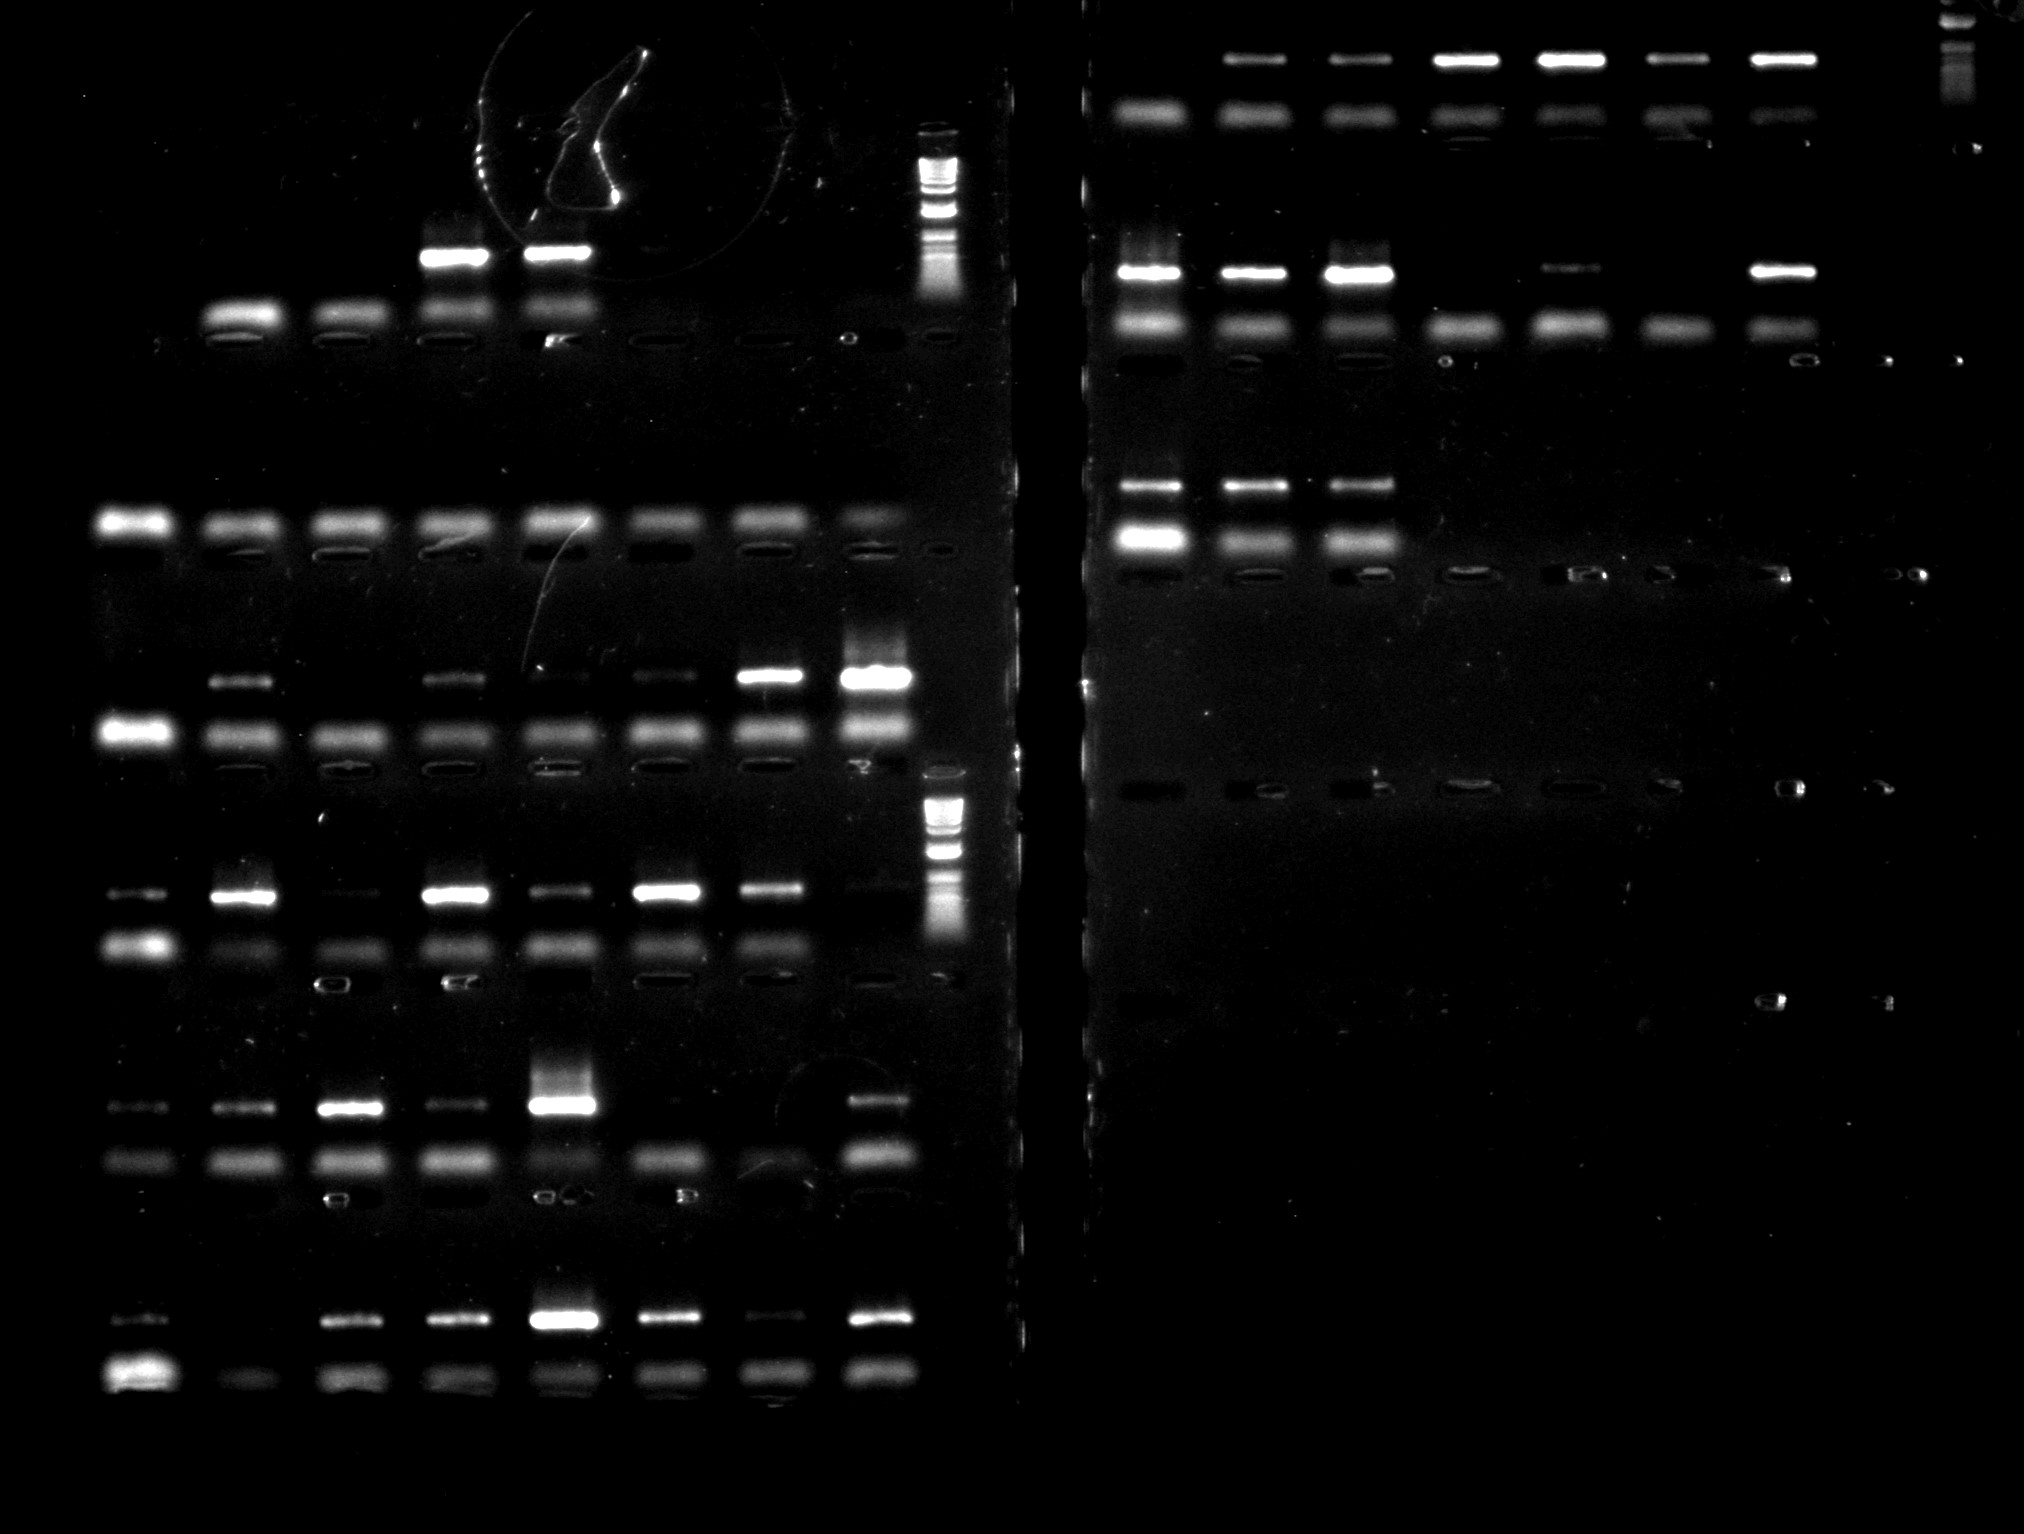
Aneura DNA amplified for rpoC1 region – first two rows with TBT-PAR additive; second two rows with CES additive
For a set of the rpoC1 amplifications, although all samples amplified using both additives, the bands from the reactions with CES (the three lowest rows in the gel image) are rather brighter than those from the reactions with TBT-PAR (the upper three rows), meaning that there is more amplified product in them. However, the CES bands do appear slightly more smeary, so it may be worth comparing the quality of sequence data from both sets of reactions as well as just considering amplification success.
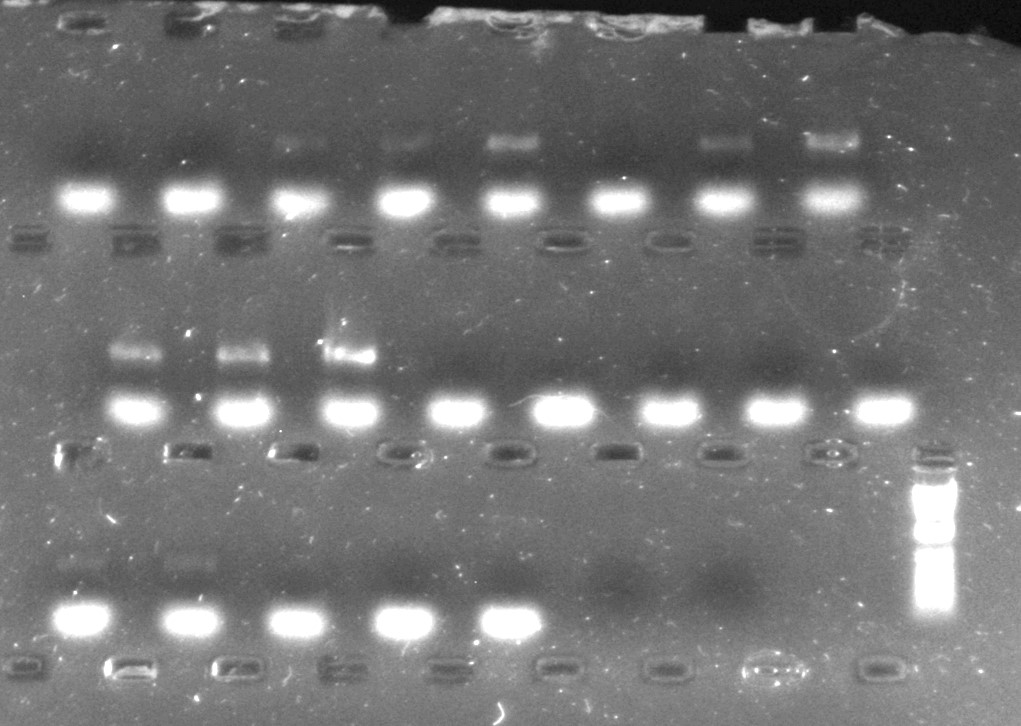
The gels for the rbcL samples (shown below) are harder to interpret – the consistent bright bands are not the PCR product that I am looking for, but represent an artefact of the reaction known as “primer dimer”; the PCR product is the second slower (and therefore, longer) DNA fragment that is sometimes present. There seem to be more samples that have amplified with the CES additive, although a few samples that have failed with CES have instead amplified with TBT-PAR, meaning that in this instance, having used both protocols in parallel will allow me to generate DNA sequences from more accessions of Aneura than I would have been able to, had I just used one PCR protocol.
Aneura DNA amplified for rbcL plant barcode region with CES additive
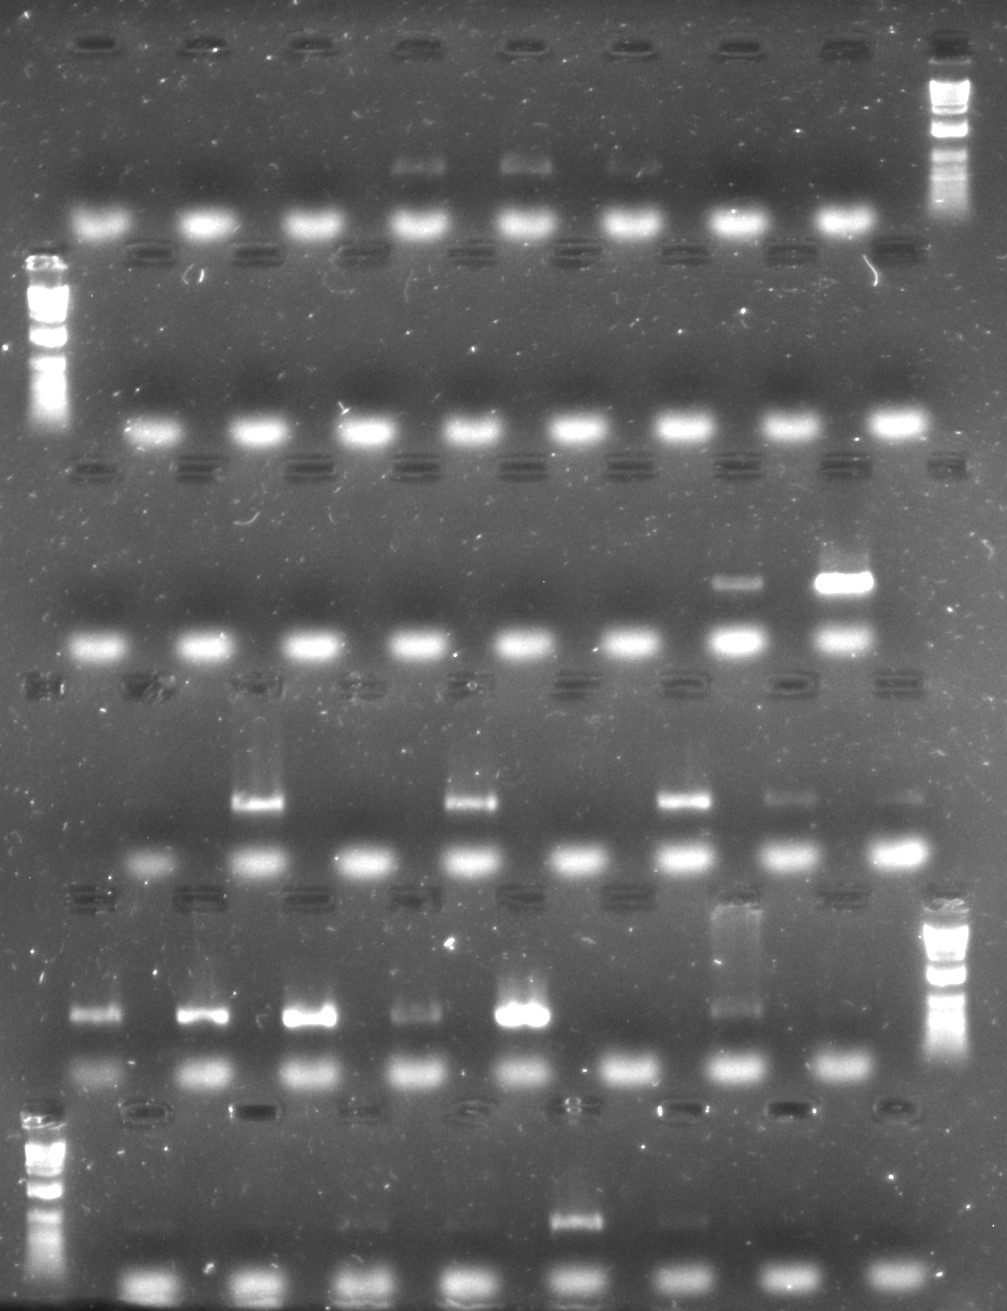
Aneura DNA amplified for rbcL plant barcode region with TBT-PAR additive (2 gel images)
The only recommendation that I can think of from this is that, if time is pressing, the DNA samples are difficult to access, and you need as much amplification as possible as fast as possible, do two sets of PCR reactions, using both additives.
This does, however, have the unfortunate side effect of doubling the cost of your PCR, as well as giving you twice as many samples to load onto your gels…
See also: Botanics Stories: Sparking additions in the Molecular Lab. http://stories.rbge.org.uk/archives/2271