The oldest specimens in the herbarium of the Royal Botanic Garden Edinburgh was collected in 1697, a little over 320 years ago. It was collected by Alexander Brown on the Cape of Good Hope in South Africa. A quarter of a millennium later, it was identified as a Myrsine africana L. by Ian Hedge, who remains a research associate at the gardens to this day.
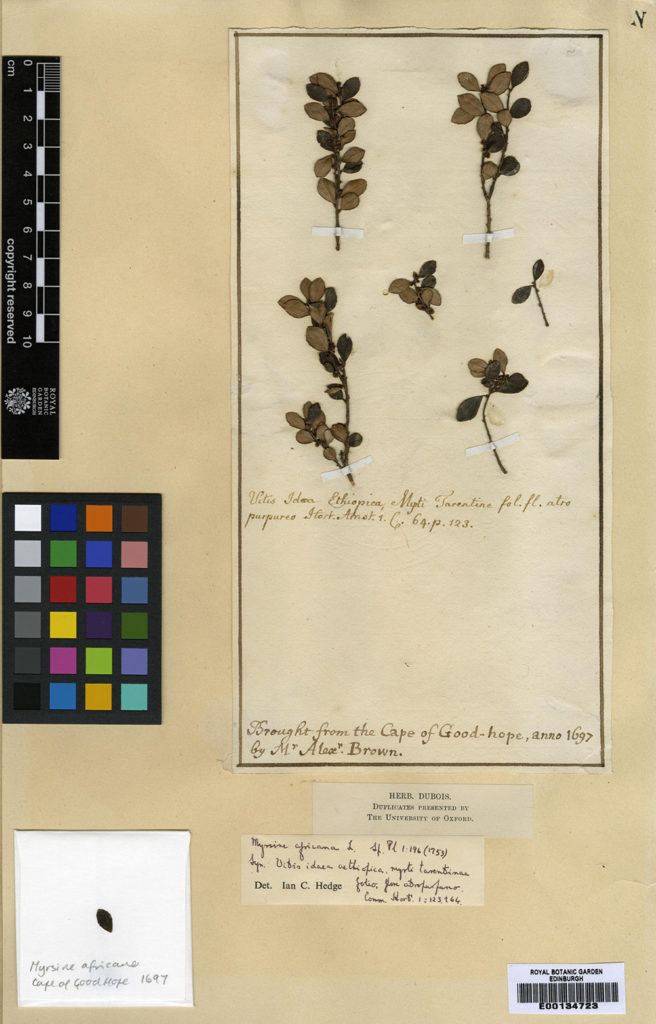
We do not know exactly why Alexander Brown made this herbarium specimen but what he effectively did was to make a data point. His collection, like every one of the three million specimens in the RBGE herbarium, is a record of a plant in space and time. With modern analytical methods, we can use these records and those from other herbaria around the world to run analyses that would have been fantastical to Alexander Brown and his contemporaries. As a herbarium botanist, this is one of the things that fascinates me – just what can we do do with herbarium data.
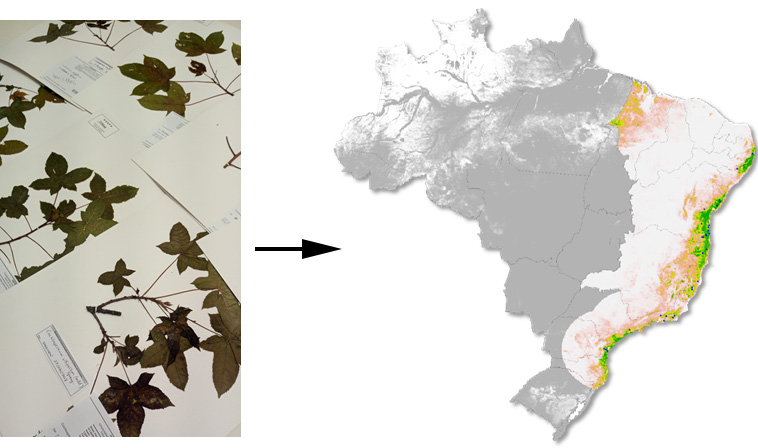
One such method is Species Distribution Modelling. Here, we take all of the herbarium records for a single species and examine the environment they were collected in. We can then predict where else that species might live: areas nearby with similar environments. This converts our species records – a few scattered points on a map – to a continuous range map for our species’ range. With enough of these maps, we can start to explore patterns in the distributions of the worlds’ species.
This is great, but it is very hard to test. How can we be sure the patterns we find are real and not just an artifact of bias in our herbarium collections, or of the process of Species Distribution Modelling?
In a new paper published today in the journal Global Ecology and Biogeography, a team led by RBGE scientists in collaboration with colleagues from Brazil and the University of Edinburgh test the results of Species Distribution Models against an independent plant distribution data in northeast Brazil. Specifically, the team delimited biomes (the largest units of ecosystems) using both datasets.
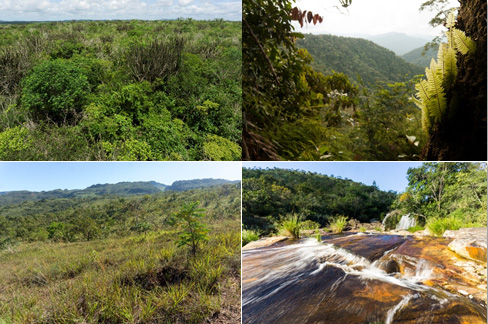
The results are very encouraging. Both methods found the same four biomes in northeast Brazil – rainforest, savanna, dry forest, and semi-deciduous forest. There were however minor differences in the distributions of these biomes, particularly of savannas.
So where does that leave Alexander Brown’s 1697 collection of Myrsine africana? Records like this are extremely relevant in the modern day. All data on plant distributions are worthwhile and Mr Brown’s collection of a single plant may one day be used to understand the largest patterns in the distributions of the word’s flora.